
Training Load 2
Last week we looked at the basics of load management and how training harder is training smarter. It is common to hear that if you train too much, you will increase your risk of injury. But last week, we learned that building high chronic workloads can actually be protective against injury. But then why do we see injuries happen after crazy workouts or when the workload is high? The issue people commonly run across when driving higher workloads is not the workloads themselves but how the athlete is prepared to handle those workloads. This brings us to our second major takeaway from Tim Gabbett’s Load Management Seminar: the load isn’t the problem but how you are prepared for that load is what becomes an issue.
We began this discussion by looking at the concept of acute and chronic workload and concluded that acute workload was representative of fatigue, and the chronic workload was representative of fitness. We can compare these two numbers and determine if we are driving adaptation or recovery by seeing if fatigue is greater than fitness or vice versa. In order to drive adaptation, we must push a little harder than the athlete is prepared for. For recovery to happen, the current load must be less than what the athlete is prepared for. We can look at this through the acute, chronic workload ratio or ACWR.
With this given fact, we know that a ratio under 1.0 would mean the athlete is, overall, in a state of recovery and a ratio above 1.0 would indicate the athlete is pushing adaptation. But what is optimal? How hard can we push without greatly increasing the risk of injury? When we want to drive recovery, how far do we have to back off? Tim Gabbett has set out to answer these questions. He has monitored thousands of athletes overall different sports and found there is a sweet spot training should be in the minimize risk for injury. You can see his findings summed up in the graph below

This data tells us exactly how to progress our athletes and keep the risk for injury as low as possible. We can see that as you push the acute to chronic workload ratio higher and higher, you increase the risk of injury. What is interesting is you also see an increased risk when the acute to chronic workload ratio drops too low. You can also see that the risk for injury grows minimally until you hit an ACWR of 1.5, where the risk of injury then quadruples. With this data, Gabbett has labeled the area between .75 and 1.4 the sweet spot for training. Almost all training should be performed in this area with a few exceptions. When you venture out of this zone, you must weigh the risk versus the reward. If there is a time in training, you really need to push progress it may be worth venturing above 1.5. There may also be certain individuals that can get away with pushing their ACWR higher than others. We will discuss what factors contribute to that in a little bit. Conversely, if there is a time you need to dissipate fatigue to show fitness, then it may be worth dropping below .75.
But remember, it is not all about the ratio! Let’s remember our first point that showed that high chronic workloads are protective against injury. If your chronic workload is super high, it will be extremely hard to get your acute workload to exceed your chronic workload, thus avoiding acute: chronic workload spikes above 1.5. The acute to chronic workload ratio allows you to progress to these high workloads safely.
Earlier I mentioned that there might be some individuals who would respond well to acute to chronic workload ratios about 1.5. There are also people who can be in the sweet spot but still be at an increased risk for injury. You can see examples of these people in the above graph. You will notice some data points (people) in the “sweet spot” but still at increased risk while others are pretty far in the “danger zone” and are still at pretty low risk. These differences can be explained by the modifiable risk factors we mentioned in part one. As more and more research has come out it seems that this sweet spot is more and more unique to the individual making the graph above just one example. For any given person that graph could be shifted to the right considerably!
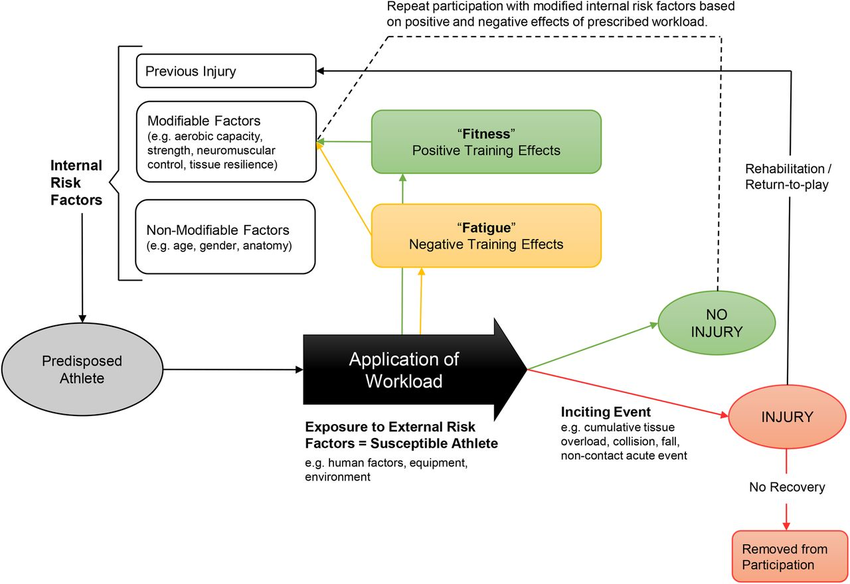
The modifiable risk factors are injury history, sleep/stress, aerobic fitness, and max strength. The latter three we have the most control over and the last two being factors directly affected by high workloads. As workloads increase, fitness increases, thus increasing your max strength and aerobic fitness, which makes you more resilient to injury, allows you to push harder in training and become even more resilient. Now that is a positive feedback loop you want to be part of!
In part one, we saw that high chronic workloads were protective for two reasons: they prevent workload spikes, and they positively affect the modifiable risk factors. High chronic workloads drive fitness, which positively affects these modifiable risk factors and can decrease the risk of injury. Conversely, low chronic loads, high levels of fatigue, and lack of training can negatively affect these factors and increase one’s risk of injury. This means that each individual is different, and you will have to find your sweet spot. This sweet spot may change as you become more or less fit.
Now we can see to minimize risk for injury you want to have workloads as high as possible and to progress to those loads in a slow and progressive manner. So, get out there and start training harder!
Written by: Paul Milano